
Quick answer
New supply pressures a short-term rental market when listings grow faster than the nights guests book. The same demand is spread across more homes, so occupancy per home falls and owners cut rates to compete. Before you buy, count how supply is changing in your segment, find the cause, and test the deal at lower occupancy and rates.
Key takeaways
- When listings grow faster than guest demand, the same booked nights are spread across more homes, so occupancy per home falls even if the market is busy.
- Count supply yourself: free sources such as Inside Airbnb snapshots, city short-term rental registries and Census building permits show the direction of supply, each with limits.
- Track the listings that compete with your home: same size, same area, same kind of guest. Total listing counts can hide a flood in one segment or a shortage in another.
- New supply often arrives in waves: a new subdivision, a rule change, a wave of buyers chasing last year's numbers. Look for the cause, not only the count.
- Before you buy, test the deal at lower occupancy and a lower nightly rate, and ask what would make guests choose your home over a newer one.
In this guide
- Why more listings can mean fewer bookings per home
- Where supply growth comes from
- How to read listing counts from public data
- Count your segment, not the whole market
- Signs that supply is outrunning demand
- What to check before you buy
- How owners can stay ahead of new supply
- The limits of supply data
- Learn more or invest with us
- The bottom line
Why more listings can mean fewer bookings per home
More listings lower each home's bookings when guest demand does not grow as fast as the number of homes. A market does not have unlimited guests. In any month, travelers book a certain number of nights there, and those nights are shared among the homes on offer.
The arithmetic is simple. If booked nights in a market rise 5% in a year while the number of comparable homes rises 20%, the average home gets about 1.05 divided by 1.20, or 87.5%, of the nights it got before. That is a 12.5% drop in nights per home, in a market where demand actually grew.
The pressure rarely stops at occupancy. Owners who see empty weekends lower their prices. New owners, who need early bookings and reviews, often price low on purpose. Dynamic pricing tools react to the softer calendar by suggesting lower rates. So a supply wave tends to hit both numbers that make up revenue: occupancy and the average daily rate. Our guide to ADR and RevPAR explains why those two move together.
Where supply growth comes from
Supply growth usually has a cause you can name, and the cause tells you whether it will last. A count of listings shows that something changed; the cause tells you what happens next.
Common causes:
- Strong recent numbers. When a market posts a good year, investors chase it. Listings that open 12 to 24 months later meet a market that has already priced in the good year.
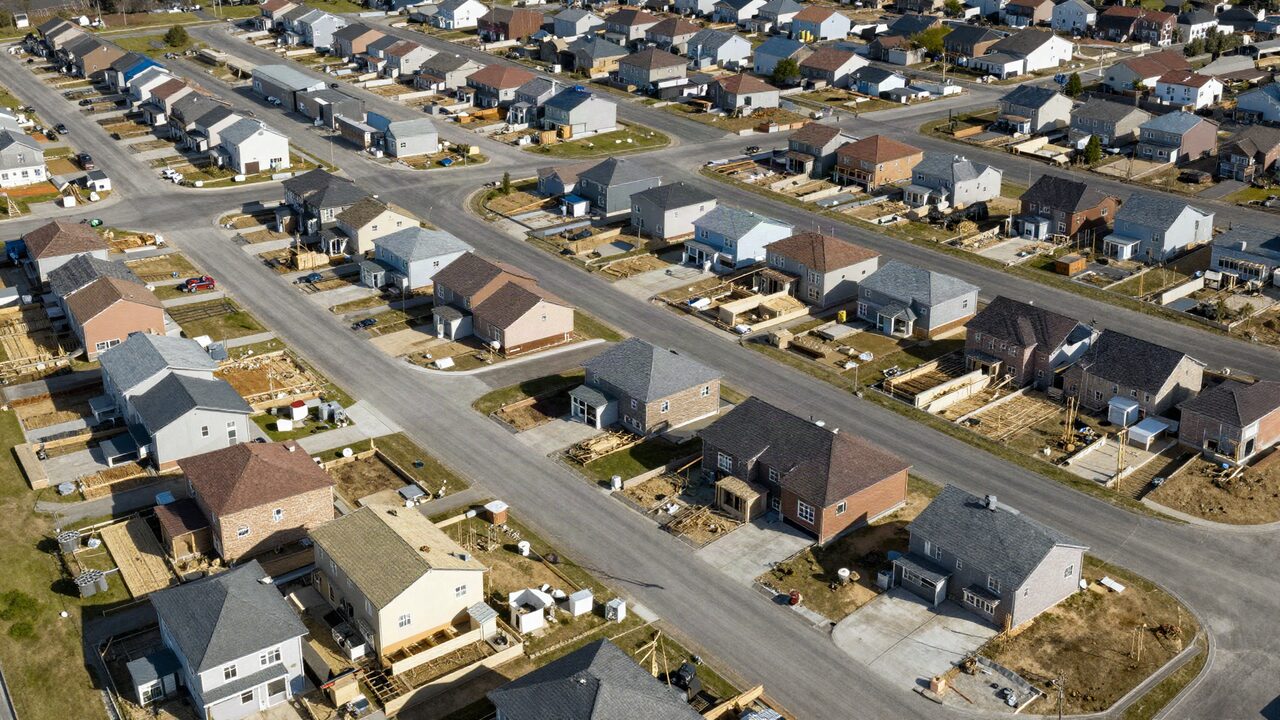
- New construction. A new subdivision, a resort community built for rentals, or a conversion of apartments can add many similar homes at once, all competing for the same guests.
- Rule changes. A city that lifts a cap, or a neighboring city that bans rentals, can push owners into a market. The reverse also happens: a new registration rule can remove listings quickly.
- Slow long-term rental or resale markets. When homes do not sell or rent well long term, some owners try short-term rental instead. These listings may leave again when the other markets recover.
- Platform and tool changes. Easier listing tools and management software lower the effort to start, which brings in part-time hosts.
| Cause | How fast it arrives | How long it tends to stay | What to watch |
|---|---|---|---|
| Investors chasing last year's numbers | Over 1 to 2 years | Until returns fall, then some leave | Listing count rising faster than reviews |
| New construction aimed at rentals | In batches as phases finish | Long term; the homes are built for it | Building permits, new phases, builder marketing |
| Rule change in the market | Fast | As long as the rule lasts | City council agendas, registry counts |
| Rule change next door | Fast | As long as the neighbor's rule lasts | Neighboring city rules |
| Owners who cannot sell or rent long term | Over months | Often short; they leave when they can | Days on market, long-term rent listings |
How to read listing counts from public data
You can measure supply for free, as long as you know what each source counts and what it misses. No single source is complete, so use two or three and look for the same direction.
Inside Airbnb. Inside Airbnb publishes free datasets of Airbnb listings for many cities and regions. Its download page says it provides "quarterly datasets for cities and regions, covering approximately the last 12 months," with detailed listings, calendar and review files for each city, and offers archived snapshots on request. The data is licensed under Creative Commons Attribution 4.0, and the site asks users to credit Inside Airbnb as the source. Comparing two snapshots of the same city shows how many listings appeared, how many disappeared and how many are whole homes.
Read its method page before you rely on the numbers. Inside Airbnb estimates occupancy from reviews, using a 50% review rate to turn reviews into estimated bookings, a city average stay or 3 nights where none is published, and a cap of 70%. It also warns that its calendar data cannot tell a booked night from a night the host blocked, and that listing locations are shifted by up to about 450 feet for privacy. It calls the data "a snapshot of listings available at a particular time." That makes it good for counting listings and spotting trends, and weaker for exact occupancy.
City registries and permit lists. Many cities now require short-term rental hosts to register or hold a permit. New York City's Local Law 18, for example, requires hosts to register with the Mayor's Office of Special Enforcement and bars booking platforms from processing transactions for unregistered rentals. Where a city publishes its permit list or counts, it shows the legal supply, which can be very different from what is listed online. Look on the city's planning, finance or code enforcement pages, or ask for the numbers through a public records request.
Census building permits. The US Census Bureau's Building Permits Survey reports permits for new privately owned residential construction monthly, year to date and annually, at the national, state, metro area, county and place levels. It cannot tell you which new homes will become rentals. It can tell you whether a county is building far more homes than before, which matters most in places where new communities are built and sold as vacation homes.
Booking site searches. Search the major booking sites for your target dates, home size and area, and record the count each month. It is slow and rough, but it covers more than one platform and shows the homes a guest actually sees.
Count your segment, not the whole market
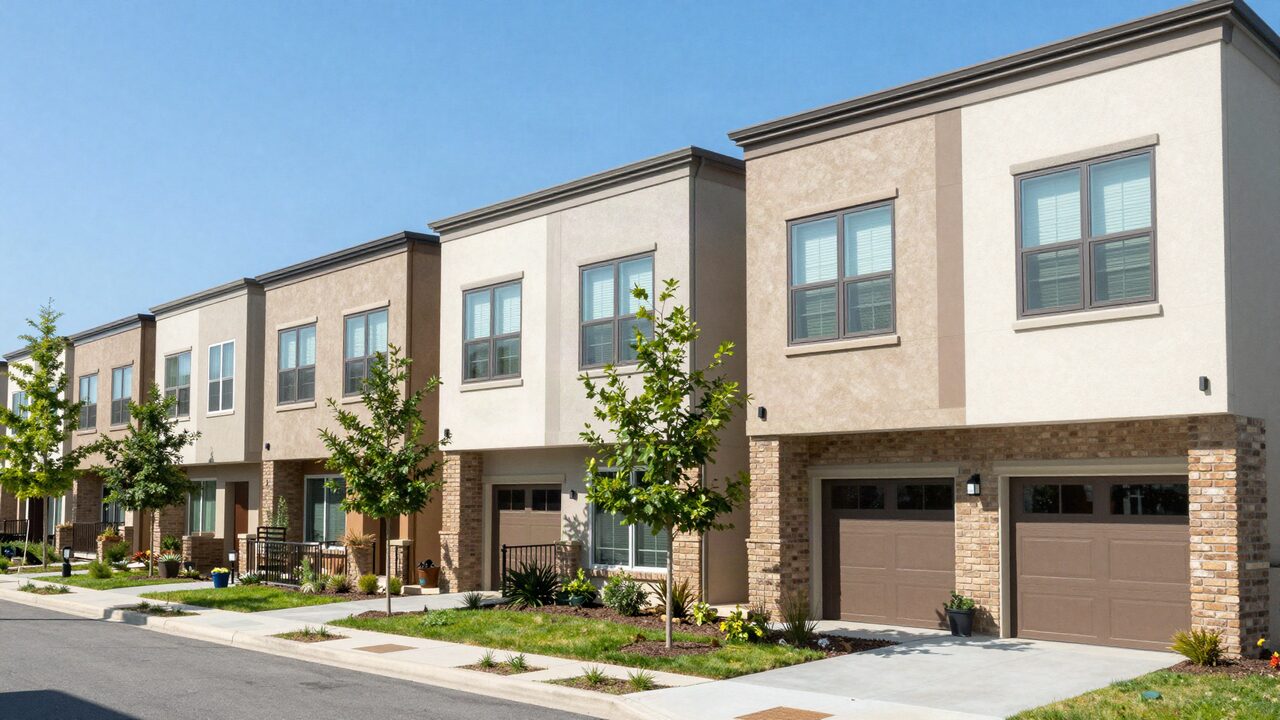
The listings that matter are the ones a guest would compare with your home. A city can add a thousand studio apartments and barely touch a seven-bedroom house, or add twenty large homes in one new community and change the picture for every group home nearby.
Filter the data down before you draw conclusions:
- Type. Whole homes only, not private rooms.
- Size. Bedrooms and maximum guests close to yours. For a group home, a five-bedroom and an eight-bedroom house serve different groups.
- Area. The part of the market guests choose for the same reason, such as near the same park, lake or venue.
- Activity. Listings with recent reviews or open calendars, not ones that have gone quiet.
- Quality and features. Pools, game rooms, lake access, parking for several cars: the features your guests filter for.
Then look at both sides of the change. How many new comparable listings appeared since the last snapshot? How many left? Net growth in active, comparable homes is the number to track.
Signs that supply is outrunning demand
Supply is outrunning demand when listings rise but the signs of bookings do not. You will rarely see real booking data before you buy, so look for indirect signals that point the same way.
Signals worth checking:
- Listing growth faster than review growth. Reviews come from stays. If comparable listings grew a lot between snapshots but new reviews in the segment barely moved, the new homes are splitting existing demand.
- More open peak dates. Check the same peak weekends a few months out over several months. If more comparable homes stay open closer to the date, the market is softer.
- Falling rates on the same homes. Track the nightly price of the same ten comparable listings for the same dates. A broad drop suggests owners are competing on price.
- Discounts and longer minimum-stay changes. Owners add weekly discounts and loosen minimum stays when calendars fill slowly.
- Homes for sale with rental furniture. A rise in furnished homes listed for sale, or listings that disappear after a year, can mean some owners are leaving.
- A wave of new homes in one place. New construction aimed at rental buyers, or many similar listings with the same photos and layout, often means a builder or one large operator added supply at once.
Demand signals to set against them: new hotels or attractions, airport routes, employers, event venues, conference centers and growth in visitor counts from the local tourism office. If both sides are rising, ask which is rising faster.
What to check before you buy
Before you buy, find out how much new supply is coming in your segment and how much of a drop in occupancy and rate the deal can take. The checks below take a few hours and can save a bad purchase.
| Check | Where to look | What a warning looks like |
|---|---|---|
| Net growth in comparable listings | Two or more Inside Airbnb snapshots, your own monthly search log | Comparable homes up sharply while reviews are flat |
| New construction nearby | Census building permits by county or place, county planning pages, builder sites | New phases of similar homes marketed to rental buyers |
| Legal supply | City registry or permit list, council agendas | Online listings far above permits, or rules changing soon |
| Rates on the same homes | Booking sites, same dates, tracked over months | Prices falling across the board for peak dates |
| Open peak dates | Booking sites a few months out | More comparable homes still open close to the date |
| How your home stands out | The comparable listings' photos, reviews and features | Newer homes with the same layout and more features |
Then put the risk into the numbers. Run the deal at your base case, then again with occupancy and the nightly rate both lower, because supply growth usually lowers both at once. Our guide to stress-testing a rental deal shows how to build that table, and the free calculators at /investors/tools let you move occupancy and rate and watch cash flow and debt coverage change. If the deal only works when the market stays as tight as last year, it depends on no new homes arriving.
How owners can stay ahead of new supply
Owners hold up best against new supply when their home is hard to copy and their bookings do not depend on one search page. The goal is to be the home guests choose even when they have more choices.
What tends to help:
- Fit one kind of group well. A home set up clearly for family reunions, team retreats or youth sports teams competes on fit, not only on price.
- Features a new build cannot easily match. More beds, more bathrooms, a big table that seats everyone, outdoor space, parking for several cars, or a location close to what guests come for.
- Reviews and repeat guests. A long record of good reviews is something a new listing does not have yet. Past guests who book again do not need to find you in a crowded search.
- More than one channel. A home that books only through one platform is exposed to that platform's ranking as well as to new supply. Our guide to underwriting platform risk covers that side.
- Pricing that responds without panic. Matching every new listing's discount trains the market to expect lower rates. A better response is often a small, targeted change for the dates that are slow, while holding the rate on dates that still book.
Some supply waves fade. When new owners find returns lower than they expected, a share of them sell or switch to long-term rentals. Owners who planned for a slower stretch and kept a cash reserve are the ones still there when it does.
The limits of supply data
Supply data shows direction more than exact size, so treat every count as a range. Each source has gaps that can mislead you if you read it alone.
- One platform only. Inside Airbnb covers Airbnb listings. Homes listed only on other sites, or booked direct, are missing.
- Listed is not active. Some listings sit idle with blocked calendars. Others are the same home listed twice.
- Locations are approximate. Shifted coordinates can put a listing on the wrong side of a neighborhood boundary.
- Occupancy is modeled. Review-based estimates rest on assumptions about how often guests review and how long they stay.
- Permits are not rentals. Building permits count new homes. Most become primary homes or long-term rentals.
- Snapshots lag. A quarterly snapshot can miss a wave that started last month.
None of this makes the data useless. It means you should compare sources, track the same filtered segment over time, and check the result against what local managers and the booking calendars tell you.
Learn more or invest with us
If you want to run the numbers on a specific home, start with the free calculators at /investors/tools, and read our market reports for seasons and demand in the areas where we operate. If you are an accredited investor interested in investing with JekkyStay, visit our investor page.
This is general information, not tax, legal or investment advice. Talk to a qualified advisor about your situation before you buy.
The bottom line
New supply hurts when the number of comparable homes grows faster than the nights guests book. Count supply in your own segment from more than one public source, find out why it is growing, and look for signs that bookings are not keeping up. Then test the deal at lower occupancy and a lower rate at the same time. A deal that still works with more competition, in a home that is hard to copy, is the one that holds up when the next wave of listings arrives.
Frequently asked questions
Why does occupancy fall when new listings arrive?
Guests book a certain number of nights in a market. If the number of homes grows faster than those nights, each home gets a smaller share on average. Owners often respond by cutting rates, which pulls the nightly rate down too.
Where can I find how many short-term rentals a city has?
Inside Airbnb publishes free quarterly snapshots of Airbnb listings for many cities under a CC BY 4.0 licence. Some cities keep a short-term rental registry or permit list. Paid data services track more platforms. Each source counts differently, so compare like with like.
Do Census building permits tell me how many rentals are coming?
Not directly. The Census Building Permits Survey counts permits for new privately owned homes by place, county and metro area. It shows how much housing is being built, not how much of it will become rentals, so treat it as an early signal only.
Is a market with fast listing growth always a bad buy?
No. Growth can follow real demand, such as a new attraction, employer or airport route. The risk is growth that outpaces demand, or growth concentrated in the exact type of home you plan to buy.
How can a home compete when supply rises?
By being hard to copy: more bedrooms or beds than nearby homes, a layout that fits a specific kind of group, strong reviews, a direct booking list and a location newer homes cannot match. Price cuts alone rarely hold up.
Can rules reduce supply?
They can. Registration laws, permit caps and zoning limits can take listings off the market. New York City's registration law, for example, bars booking platforms from processing transactions for unregistered short-term rentals. That can help existing legal owners, but the same rules can also apply to you.